Questions on Graphical Understanding of Motion, the kind your examinations ask. Solve one on paper. Then tell the book how it went. The book believes you, and it uses your answer to plan your revision.
0%
Nothing marked yetMark honestly. Peek at the answer only after your own attempt.
Kinematic Graphs
24 questions · after Lesson 5, Graphs of Real Motions
x-t graphs
Q1
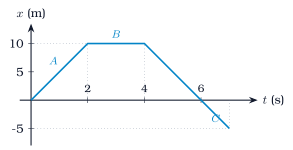
The figure shows the position of a body against time in three straight segments.
Find the velocity in each segment.
At what time does the body pass through the origin on its way back?
Find the total distance and the final displacement.
Answer(i) \(5\); \(0\); \(-5\) m/s (ii) \(6\) s (iii) \(25\) m; \(-5\) m
In \(C\), \(x = 10 - 5(t - 4)\). \(x = 0\) gives \(t = 6\) s.
Distance \(= 10 + 0 + 15 = 25\) m. Displacement \(= x_{\text{final}} - x_{\text{initial}} = -5\) m.
How did it go?
Q2
On an \(x\)-\(t\) graph, say what motion each shape shows.
A sloping straight line.
A horizontal line.
A curve that bends upward.
Answer(i) uniform velocity (ii) at rest (iii) speeding up
Solution
Constant slope, so constant velocity: uniform motion.
Zero slope: the body is at rest.
The slope grows with time: the body speeds up.
How did it go?
Q3
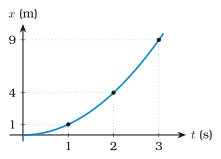
The figure shows \(x = t^2\), in SI units.
Find the average velocity from \(t = 0\) to \(2\) s from the graph.
Find the instantaneous velocity at \(t = 1\) s and at \(t = 2\) s.
Is the acceleration constant? What is it?
Answer(i) \(2\) m/s (ii) \(2\) m/s; \(4\) m/s (iii) yes, \(2\) m/s\(^2\)
Solution
\(\bar v = \dfrac{4 - 0}{2} = 2\) m/s, the slope of the chord from \((0, 0)\) to \((2, 4)\).
\(v = \dfrac{dx}{dt} = 2t\): \(2\) m/s at \(1\) s and \(4\) m/s at \(2\) s, the slopes of the tangents.
\(a = \dfrac{dv}{dt} = 2\) m/s\(^2\), constant. A parabolic \(x\)-\(t\) graph always means uniform acceleration.
How did it go?
Q4
The \(x\)-\(t\) lines of two cars cross at a point. What does the crossing point mean? Can two \(v\)-\(t\) lines that cross mean the same thing?
Answersame place, same time; no, same velocity only
Solution
At the crossing the two cars have the same \(x\) at the same \(t\): they are side by side, one overtaking the other.
Crossing \(v\)-\(t\) lines only mean the two cars have the same velocity at that instant. They may be far apart.
How did it go?
Q5
Why can an \(x\)-\(t\) graph never be vertical, and never turn back on itself along the time axis?
Answerinfinite speed; two positions at one time
Solution
A vertical segment would mean a change of position in zero time, an infinite speed. Turning back along the time axis would give the body two positions at one instant, which is impossible. Time only moves forward.
How did it go?
v-t graphs
Q6
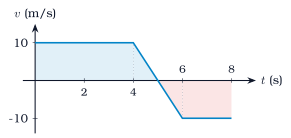
The figure shows the velocity of a body against time.
Find the acceleration from \(4\) s to \(6\) s.
Find the displacement in \(8\) s.
Find the distance travelled in \(8\) s.
Answer(i) \(-10\) m/s\(^2\) (ii) \(20\) m (iii) \(70\) m
Solution
Slope \(= \dfrac{-10 - 10}{2} = -10\) m/s\(^2\).
Areas: \(0\) to \(4\) s: \(40\) m. \(4\) to \(5\) s: \(+5\) m. \(5\) to \(6\) s: \(-5\) m. \(6\) to \(8\) s: \(-20\) m. Displacement \(= 40 + 5 - 5 - 20 = 20\) m.
Distance adds the magnitudes: \(40 + 5 + 5 + 20 = 70\) m.
How did it go?
Q7
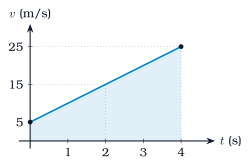
The figure shows the velocity of a body against time.
Find the acceleration. Describe the \(a\)-\(t\) graph.
Find the displacement in \(4\) s.
What shape is the \(x\)-\(t\) graph? Write \(x(t)\), taking \(x = 0\) at \(t = 0\).
Answer(i) \(5\) m/s\(^2\); horizontal line (ii) \(60\) m (iii) parabola; \(x = 5t + 2.5t^2\)
Solution
\(a = \dfrac{25 - 5}{4} = 5\) m/s\(^2\). The \(a\)-\(t\) graph is a horizontal line at \(5\) m/s\(^2\).
Area of the trapezium: \(\dfrac{1}{2}(5 + 25) \times 4 = 60\) m.
Uniform acceleration gives a parabola: \(x = ut + \dfrac{1}{2}at^2 = 5t + 2.5t^2\). Check: \(t = 4\) gives \(20 + 40 = 60\) m.
How did it go?
Q8
Describe the \(v\)-\(t\) graph of a ball thrown straight up and caught at the same height. Take up as positive. Where does the graph cross the time axis?
Answerstraight line, slope \(-g\); at the top
Solution
The velocity starts at \(+u\), falls uniformly through zero and reaches \(-u\) when caught. The graph is one straight line of slope \(-g\). It crosses the time axis at the highest point, where \(v = 0\).
How did it go?
Q9
On a \(v\)-\(t\) graph, what does an area below the time axis mean? How do the displacement and the distance differ when the graph has areas above and below the axis?
Below the axis the velocity is negative, so the area counts as negative displacement: the body moves back. The displacement is the sum of the signed areas; the distance is the sum of their magnitudes.
How did it go?
Q10
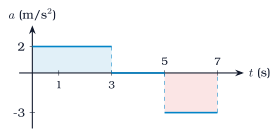
The figure shows the acceleration of a body that starts from rest.
Find the velocity at \(t = 3\) s, \(5\) s and \(7\) s.
Describe the \(v\)-\(t\) graph in each interval.
Find the total displacement in \(7\) s.
Answer(i) \(6\); \(6\); \(0\) m/s (ii) rising line; flat; falling line (iii) \(27\) m
Solution
\(v\) changes by the area under \(a\)-\(t\). \(0\) to \(3\) s: \(2 \times 3 = 6\) m/s. \(3\) to \(5\) s: no change, \(6\) m/s. \(5\) to \(7\) s: \(-3 \times 2 = -6\), so \(v = 0\).
A line rising from \(0\) to \(6\) m/s, then a horizontal line at \(6\) m/s, then a line falling to \(0\).
Area under the \(v\)-\(t\) graph: \(\dfrac{1}{2} \times 3 \times 6 + 2 \times 6 + \dfrac{1}{2} \times 2 \times 6 = 9 + 12 + 6 = 27\) m.
How did it go?
Q11
Name the shape of the \(v\)-\(t\) graph for each motion.
Uniform velocity.
Uniform acceleration.
Acceleration that grows with time.
Answer(i) horizontal line (ii) sloping line (iii) curve bending up
Solution
A horizontal line.
A sloping straight line.
A curve whose slope keeps increasing, bending upward.
How did it go?
Conversions
Q12
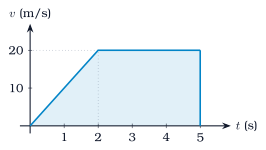
The figure shows the velocity of a car against time.
Find the displacement in the first \(2\) s and in the next \(3\) s.
Find the average velocity over the \(5\) s.
Sketch the \(x\)-\(t\) graph in words: what shape in each part?
Answer(i) \(20\) m; \(60\) m (ii) \(16\) m/s (iii) parabola, then line
Solution
Triangle: \(\dfrac{1}{2} \times 2 \times 20 = 20\) m. Rectangle: \(3 \times 20 = 60\) m.
\(\bar v = \dfrac{80}{5} = 16\) m/s.
For the first \(2\) s the \(x\)-\(t\) graph is a parabola bending upward (speeding up). After that it is a straight line of slope \(20\) m/s.
How did it go?
Q13
A body moves with \(x = 5t^2\) for the first \(2\) s and then with constant velocity. Here \(x\) is in metres and \(t\) is in seconds. Find the velocity at \(t = 2\) s and the position at \(t = 5\) s.
Answer\(20\) m/s; \(80\) m
Solution
\(v = 10t = 20\) m/s at \(t = 2\) s, when \(x = 20\) m. From then on \(x = 20 + 20(t - 2)\), so at \(t = 5\) s: \(x = 20 + 60 = 80\) m.
How did it go?
Q14
A body's velocity is \(v = 3t\) from \(t = 0\) to \(2\) s, then stays constant to \(t = 4\) s, and then falls uniformly to zero at \(t = 6\) s. Here \(v\) is in m/s and \(t\) is in seconds. Find the distance covered in each part and in all.
Answer\(6\) m; \(12\) m; \(6\) m; \(24\) m
Solution
Part 1: triangle, \(\dfrac{1}{2} \times 2 \times 6 = 6\) m. Part 2: rectangle, \(6 \times 2 = 12\) m. Part 3: triangle, \(\dfrac{1}{2} \times 2 \times 6 = 6\) m. Total \(= 24\) m.
How did it go?
Q15
The \(a\)-\(t\) graph of a body starting from rest is the straight line \(a = 4t\), in SI units. What shape is the \(v\)-\(t\) graph? Find \(v\) at \(t = 2\) s.
Answerparabola; \(8\) m/s
Solution
\(v = \int_0^t 4t\,dt = 2t^2\): the \(v\)-\(t\) graph is a parabola. At \(t = 2\) s: \(v = 8\) m/s, the area of the triangle under \(a = 4t\).
How did it go?
Interpretation
Q16
For a \(v\)-\(t\) graph, state what each feature gives.
The slope.
The area under the graph.
A point where the graph cuts the time axis.
Answer(i) acceleration (ii) displacement (iii) velocity zero, turning point
Solution
The acceleration.
The displacement.
An instant when the velocity is zero: the body stops and, if the line goes through, reverses direction.
How did it go?
Q17
The \(x\)-\(t\) graph of a body is a straight line from \((0, 20\text{ m})\) to \((4\text{ s}, 0)\). Find the velocity and write \(x(t)\). In which direction does the body move?
Answer\(-5\) m/s; \(x = 20 - 5t\); towards the origin
Solution
Slope \(= \dfrac{0 - 20}{4} = -5\) m/s, so \(x = 20 - 5t\). The body moves in the negative direction, towards the origin, and reaches it at \(t = 4\) s.
How did it go?
Q18
Two cars move along a road with \(x_A = 10t\) and \(x_B = 5t + 30\). Here \(x\) is in metres and \(t\) is in seconds.
Which car is ahead at \(t = 0\), and by how much?
When and where do the \(x\)-\(t\) lines cross?
Answer(i) \(B\), \(30\) m (ii) \(6\) s; \(60\) m
Solution
At \(t = 0\), \(x_A = 0\) and \(x_B = 30\) m: \(B\) is \(30\) m ahead.
\(10t = 5t + 30\) gives \(t = 6\) s, at \(x = 60\) m. \(A\) is faster, so \(A\) catches \(B\) there and then leads.
How did it go?
Q19
The \(v\)-\(t\) graph of a body is a horizontal line at \(v = -3\) m/s from \(t = 0\) to \(5\) s. Find the displacement and the distance, and describe the motion.
Answer\(-15\) m; \(15\) m; steady, backward
Solution
Displacement \(= -3 \times 5 = -15\) m; distance \(= 15\) m. The body moves at a steady \(3\) m/s in the negative direction, with zero acceleration.
How did it go?
Q20
The slope of an \(x\)-\(t\) graph decreases steadily and becomes zero. Describe the motion and the sign of the acceleration.
Answerslowing to rest; negative
Solution
The slope is the velocity, so the body slows down and comes to rest. The velocity decreases while positive, so the acceleration is negative.
How did it go?
Small situations
Q21
A \(v\)-\(t\) graph is a triangle with base \(10\) s and height \(20\) m/s. Find the displacement and the average velocity.
Answer\(100\) m; \(10\) m/s
Solution
Displacement \(=\) area \(= \dfrac{1}{2} \times 10 \times 20 = 100\) m. \(\bar v = \dfrac{100}{10} = 10\) m/s, half the peak.
How did it go?
Q22
A body starts from rest with uniform acceleration. Show that the graph of \(v^2\) against \(x\) is a straight line through the origin. If its slope is \(8\) m/s\(^2\), find the acceleration.
Answer\(v^2 = 2ax\); \(4\) m/s\(^2\)
Solution
With \(u = 0\), \(v^2 = 2ax\): this is \(y = mx\) with \(y = v^2\) and slope \(2a\), a straight line through the origin. \(2a = 8\) gives \(a = 4\) m/s\(^2\).
How did it go?
Q23
The \(x\)-\(t\) graph of a body is the parabola \(x = 3t^2\), in SI units. Describe the \(v\)-\(t\) and \(a\)-\(t\) graphs and give the acceleration.
\(v = \dfrac{dx}{dt} = 6t\): a straight line through the origin with slope \(6\). \(a = \dfrac{dv}{dt} = 6\) m/s\(^2\): a horizontal line.
How did it go?
Q24
A ball is thrown up and caught. Compare the speed-time graph with the velocity-time graph. Which of the two is a single straight line?
Answerspeed: V shape; velocity: one line
Solution
The velocity-time graph is one straight line from \(+u\) down through zero to \(-u\). The speed-time graph is \(|v|\): it falls to zero at the top and rises again, a V shape. The velocity graph is the single straight line.